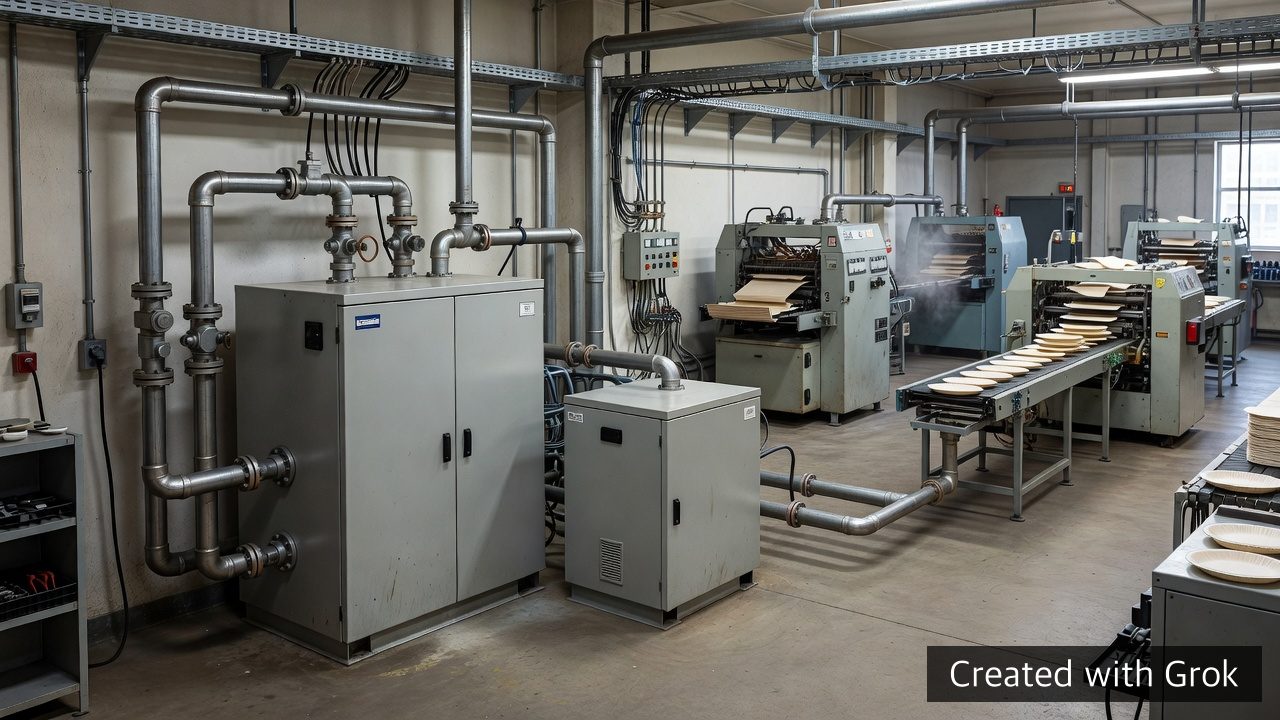
When an aging compressor motor fails in a plant whose printing, converting, and packaging lines share one air system, restoring production comes before calculating efficiency. Plant and energy teams should not copy Aspen Products’ reported “about 12%” as their own target; they should test whether it is reproducible by aligning power, pressure, flow, and production data on the same timeline. The sheet below turns an emergency replacement into a one-page verification plan for the baseline, leak load, compressor loading, air quality, and hold conditions.
 Compressed air can determine production continuity before it becomes an efficiency project. AI-generated image · Created with Grok.
Shop-floor problem
According to an ELGi release distributed by Business Wire on September 2, 2026, Aspen Products’ approximately 600,000-sq-ft (55,742-sq-m) facility uses compressed air for printing presses, converting machinery, packaging lines, conveyors, and robotic handling. The public account describes a paper-products printing, converting, and packaging operation—not a pulp-and-paper mill.
The sequence was reported as follows:
- The motor on an aging 200-hp compressor failed.
- G3 Industrial Solutions delivered a 100-hp fixed-speed ELGi EG75-125 rental unit in about two and a half hours and connected it within roughly four hours of the initial call.
- Aspen used the rental for about two and a half weeks, then bought it for permanent service.
- Months later, a second aging 200-hp compressor failed; a variable-speed EG160V-125 was added to follow fluctuating demand.
- With the fixed-speed and variable-speed units operating together, the company reported running about 12% more efficiently than with the old equipment.
The number is useful, but it is not an independently verified result. The public sources do not disclose the comparison period, production normalization, meter locations and accuracy, before-and-after pressure setpoints, flow, leak load, pressure dew point, or the power boundary for auxiliaries. “12%” should therefore be treated as a hypothesis to verify on the buyer’s own system, not as a purchase guarantee.
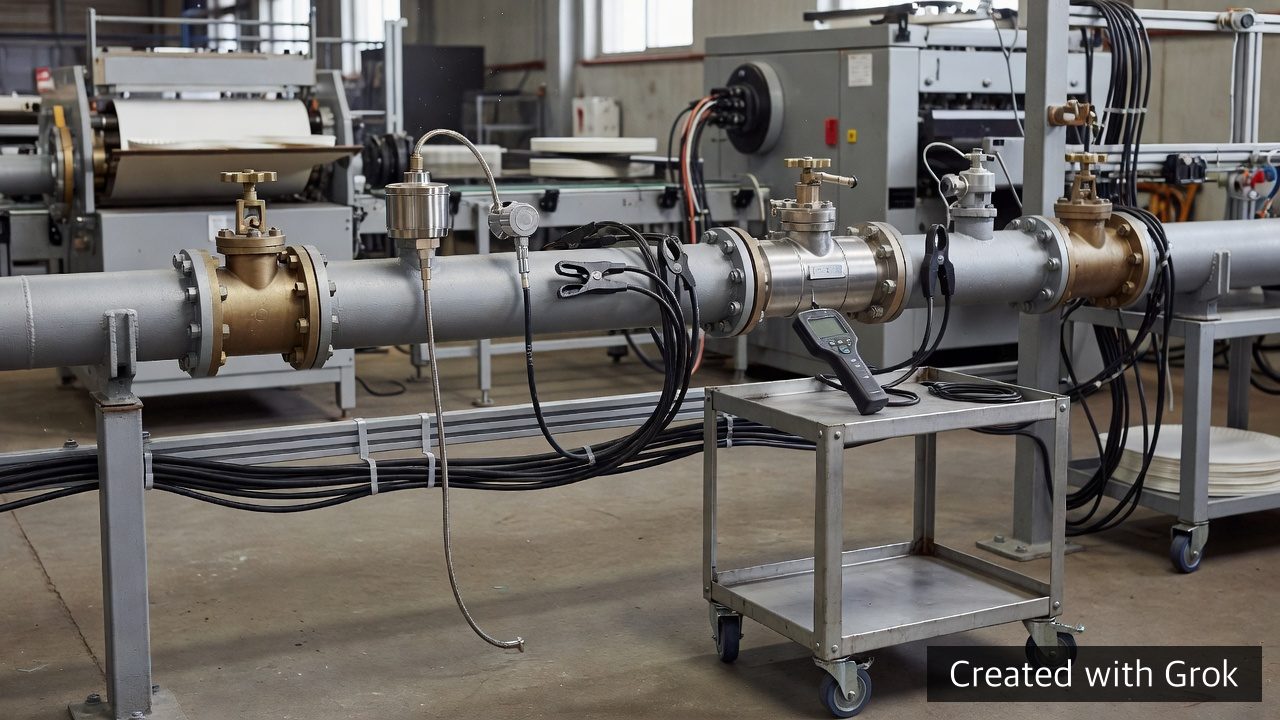 Power alone can mistake lower production or higher pressure for an efficiency gain. AI-generated image · Created with Grok.
Evidence to verify
The U.S. Department of Energy’s industrial compressed-air sourcebook recommends measuring power, pressure, flow, and temperature under different operating conditions, estimating leak load, and correlating the results with production. Applying the Aspen case to another plant requires at least five data groups with synchronized timestamps.
1. Normalize power by production and pressure
A lower kWh total can simply reflect fewer production hours or lower output. Record good pieces or good tonnes, operating hours, and product family for both periods, then compare:
- Production-specific energy: compressed-air-system kWh ÷ good pieces (or good tonnes)
- Flow-specific power: system kW ÷ delivered flow in Nm³/min, or kW/100 cfm at the same pressure
Keep the measurement boundary identical before and after. State whether the boundary includes only compressors or also dryers, cooling fans, and pumps.
2. Evaluate minimum pressure and pressure drop—not just the average
Log pressure simultaneously at compressor discharge, after dryers and filters, on the main header, and at the most distant critical end use. The optimized system must still satisfy the critical equipment’s minimum pressure. If pressure drop across treatment equipment or piping rises, correct the cause rather than masking it with a higher discharge setpoint.
3. Test fixed-speed and variable-speed roles against the demand profile
A variable-speed compressor can follow fluctuating demand, but the DOE sourcebook notes that package efficiency can fall near full output and at very low speed. Log each compressor’s kW, speed, load/unload time, starts and stops, and pressure setpoints. Confirm that the fixed-speed machine carries a stable base load while the variable-speed machine trims demand without control hunting.
4. Separate leak load during non-production periods
During a planned shutdown, isolate pneumatic users and log main-header flow. Remaining flow can include intentional purge, blow-off, and control air as well as leaks, so use zone isolation to separate them. The DOE sourcebook says poorly maintained systems can lose 20–30% of compressor output to leaks, but that range must not be substituted for a site measurement.
5. Verify air quality against each end use
Air for paper-product conveying, forming, and packaging can have different quality requirements at different points of use. Before reducing pressure or changing filtration, verify pressure dew point, particulate and oil requirements, filter differential pressure, and condensate-drain condition. Any air that may contact product needs a separate hazard assessment and defined quality criteria.
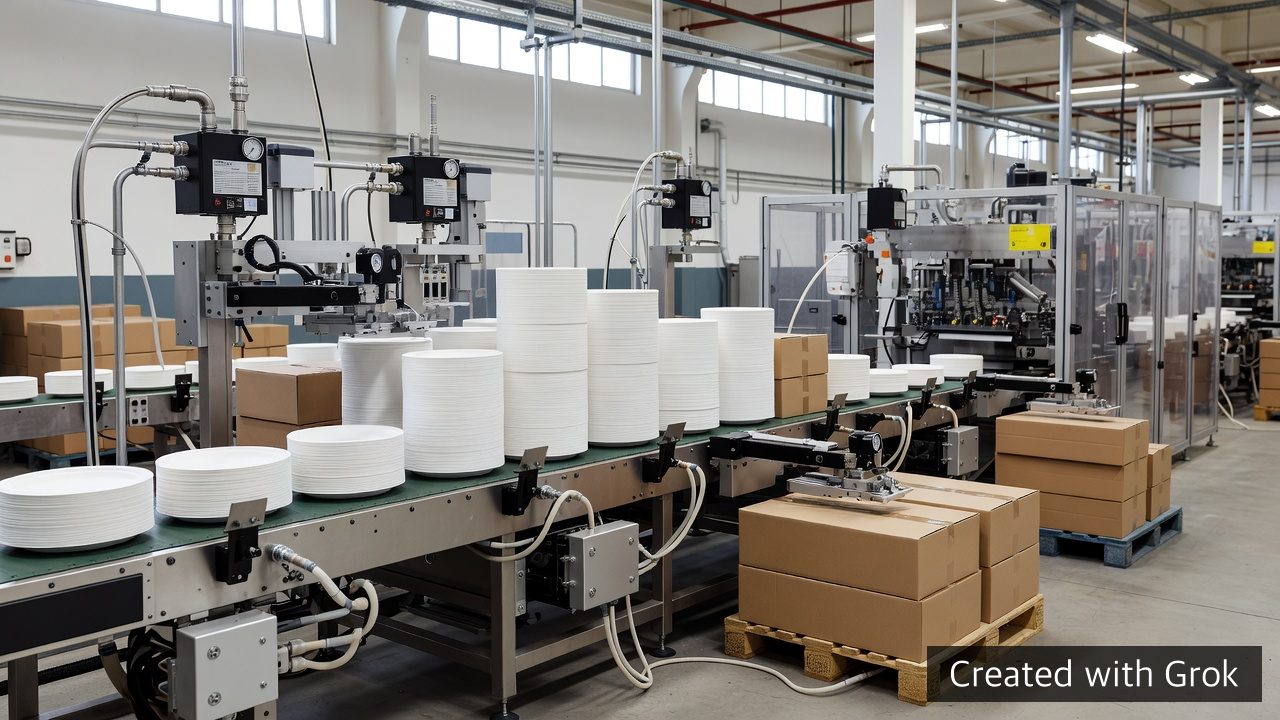 An efficiency claim must also pass pressure and quality checks at the actual end use. AI-generated image · Created with Grok.
Practical deliverable
Use the table below as a “compressed-air before/after verification sheet.” A practical starting point is seven days of baseline operation and seven days of optimized operation, including production, non-production, and all shifts. Begin with a 5–15-second sampling interval to capture demand swings, then adjust it to instrument capability and data-storage limits.
| Verification item | Time-aligned data | Calculation or comparison | Pass condition | Deliverable |
|---|---|---|---|---|
| Measurement boundary | kWh by compressor, dryer, fan, and pump; system diagram | Confirm identical included equipment | Same boundary before and after | Metered P&ID or block diagram |
| Production-specific energy | Good pieces/tonnes, scrap, runtime, product family | kWh per good unit | Repeatable improvement under comparable mix and schedule | Shift-by-shift comparison |
| Pressure stability | Discharge, post-treatment, main-header, and far-end pressure | Minimum and 5th/50th/95th percentiles; pressure drop | Far-end minimum requirement maintained; no abnormal pressure drop | Pressure-profile chart |
| Flow and specific power | Main-header flow and system kW | kW/Nm³/min or kW/100 cfm | Lower specific power at the same pressure range | Flow-power scatter plot |
| Load sharing | kW, speed, load/unload, starts/stops by compressor | Base/trim share and unloaded power | Less unnecessary unloaded operation and simultaneous trimming without hunting | Sequencing timeline |
| Leak load | Main-header and zonal flow during non-production | Leak flow normalized to the same pressure | Intentional uses separated; repaired items remeasured | Tagged leak, repair, and retest list |
| Air quality | Pressure dew point, particle/oil limits, filter differential pressure, drains | Compare with end-use requirement | Requirements maintained at critical use points | End-use quality record |
| Reliability | Alarms, downtime, starts, and maintenance history | Before/after trend | Energy improvement does not increase outage risk | Emergency and restoration procedure |
Two-week pilot sequence
- Day 0 — Freeze the basis: Approve the system diagram, measurement boundary, minimum pressure, air-quality criteria, and production unit.
- Week 1 — Record the existing operation: Do not change controls. Log power, pressure, flow, and production; use planned downtime for zonal leak checks.
- Intervention — Start with low-risk actions: Repair verified leaks; inspect restricted filters and drains; calibrate pressure sensors; adjust compressor sequencing. Reduce discharge pressure only in steps after confirming minimum end-use pressure.
- Week 2 — Record the optimized operation: Repeat the test with a comparable product mix and shift pattern, using the same boundary and sampling interval.
- Decision — Pass all three gates: Adopt the change only if production-specific energy improves repeatedly, minimum end-use pressure and air quality remain compliant, and alarms or outage risk do not increase.
One line for the capital request: “Do not use the Aspen case’s 12% as a guaranteed target; judge the investment by comparing seven-day before/after results for kWh per good unit, specific power, minimum end-use pressure, and leak load within the same measurement boundary.”
Hold conditions
Hold the “savings verified” decision if any of the following applies:
- Power data exists, but flow or production data does not, so load change cannot be separated.
- Product mix, shift hours, ambient conditions, pressure setpoints, or included equipment differ between periods.
- Dryer, filter, or cooling-system power is excluded on only one side of the comparison.
- Instantaneous minimum pressure and production alarms at the farthest critical use point were not checked.
- All non-production flow was labeled as leakage without separating intentional purge or blow-off.
- The variable-speed unit stays near minimum or maximum speed for long periods while another compressor repeatedly runs unloaded.
- End-use criteria for pressure dew point, particles, and oil have not been defined.
- Instrument calibration and timestamp synchronization have not been verified.
- The press release’s 12% figure is being treated as third-party verification or a contractual guarantee.
The transferable part of the Aspen case is not a model number. It is the combination of emergency recovery, demand-profile matching, pressure stability, and electrical monitoring. Add flow, production normalization, leak isolation, and end-use air-quality checks to distinguish equipment performance from a change in operating conditions.
About the Author
PackingMaster: Editor of Paper Pack Log. We collect and organize market trends, product information, and technical insights for the paper packaging industry.
References
- Business Wire — Compressed Air Emergency Leads to Breakthrough 12% Energy Reduction for Aspen’s Paper Packaging Production
- New Equipment Digest — Aspen Products Cuts Energy Use 12% with ELGi Compressors
- U.S. Department of Energy — Improving Compressed Air System Performance: A Sourcebook for Industry, Third Edition