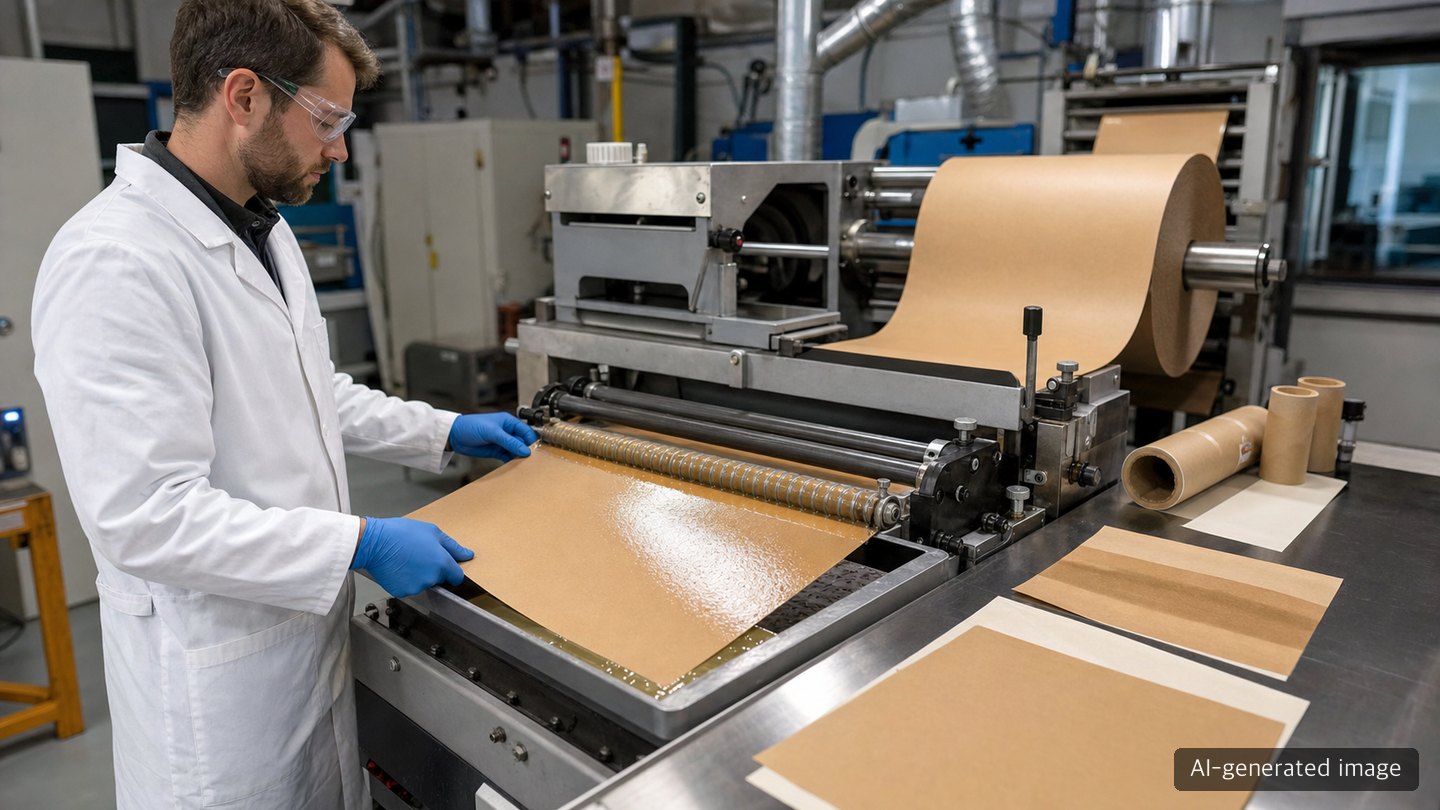
If the coat-weight gauge starts swinging during a pilot run and pinholes or fold cracks appear, the line conditions approved from laboratory barrier data need to be reopened. Changes in viscosity, shear conditions, drying and friction can prevent laboratory water and oil resistance from translating directly into stable coating quality. Below is a pilot test protocol that coating development, quality, and production engineering teams can copy directly today.
Why lab results and line results diverge
This part is editorial judgment, not sourced fact. Laboratory coating trials and production lines can differ in coating method, speed and shear conditions. Gels like nanocellulose and nanochitin are shear-thinning — viscosity drops as shear rate rises — so changing the coating speed changes how the gel actually lays down on the base paper. On top of that, a line’s drying tunnel has a temperature and residence-time profile that doesn’t match a lab oven batch-dry, and the friction and folding stress of converting simply isn’t reproduced in a static barrier test. So it passed the lab barrier test is not sufficient grounds to approve a line run — coat-weight variance and defects tend to show up only after the fact, on the line.
What the sources actually showed
A study published in Scientific Reports on 2026-07-16 (“Evaluation of the properties of gel, film and paper coated with nanocellulose and nanochitin,” DOI 10.1038/s41598-026-62541-z) established the following:
- Both the nanocellulose gel and the nanochitin gel were shear-thinning — viscosity decreased as shear rate increased.
- Single-layer and double-layer coatings were applied at a coating speed of 5 cm/s.
- Nanochitin-coated paper showed improved resistance to water, air, and oil penetration, and lower thickness at a similar coat weight.
- Nanocellulose-coated paper showed higher brightness.
- These are lab-scale results and do not indicate production readiness.
A follow-up article on AZoNano dated 2026-07-19, covering the same study, laid out the method in more detail: 1.5 wt% nanogel solids, A4 printing paper as the substrate, rod-coating at 5 cm/s in single and double layers, followed by oven drying and conditioning. The tests run were caliper (thickness), air permeability, the Hercules sizing test (water resistance), oil absorption, and brightness. The article also flagged the limits: water vapor and oxygen transmission were not tested, coated-paper durability and friction/fold performance were not evaluated, and environmental impact and commercial-scale performance were not addressed.
One thing worth stating plainly: the 5 cm/s coating speed and 1.5 wt% solids content are the specific parameters this academic study chose to compare nanocellulose against nanochitin — nothing more. Don’t mistake them for a coating window or a pass/fail spec, and don’t carry them over into a line-trial approval sheet as if they were validated production parameters.
The pilot test protocol
The table below lists what to log during a pre-line pilot, where each item’s basis comes from, and who needs to do what and when.
| Input field | Observed value (example) | Basis/status | Action |
|---|---|---|---|
| Solids content (wt%) | Actual formulation wt% used | Sourced from method description (AZoNano; study used 1.5 wt%) — line formulation needs independent verification | Coating development tests multiple pre-approved formulation levels at shear rates representing the line → redesign the formulation if coat-weight variation exceeds the internal tolerance |
| Viscosity (by shear rate) | Viscosity curve across shear rates | Confirmed by source (Sci Rep 2026, shear-thinning behavior) | Coating dev team: remeasure viscosity across the shear-rate range corresponding to actual line speed → log the delta versus the 5 cm/s lab curve and finalize a line-condition curve separately |
| Base paper type/basis weight | Actual line substrate spec | Not evaluated (study used A4 printing paper) | Production eng.: run a pre-trial coat on the actual substrate and check absorbency/surface uniformity → if the substrate changes, redo this whole table |
| Coating speed | Actual line-speed ranges | Not evaluated (study fixed at 5 cm/s) | Production engineering runs a stepped trial across pre-approved speed ranges → exclude any range where thickness variation exceeds the internal target |
| Coat weight (gsm) | Basis-weight delta before/after coating | Confirmed by source (study compared at similar coat weight) | QA measures basis weight before and after coating at representative roll positions → inspect the coating-head gap if within-roll variation grows |
| Layers (single vs. double) | Single vs. double layer comparison | Confirmed by source (Sci Rep 2026) | Coating development runs single and double layers side by side on the same substrate → reassess the extra process cost if the gain misses the pre-approved minimum effect |
| Drying conditions (temp/residence time/method) | Line drying-tunnel profile | Not evaluated (study used oven batch drying) | Production eng.: map and reproduce the tunnel’s temperature/residence-time profile → if coating cracks appear, slow the dry rate and retest |
| Thickness (caliper) | Post-coat thickness | Confirmed by source (Sci Rep 2026 — nanochitin showed lower thickness at similar coat weight) | QA measures caliper at representative roll positions → re-tune coat weight if deviation exceeds the internal tolerance |
| Air permeability | Actual measured value on line coating | Confirmed by source (Sci Rep 2026) | QA: measure air permeability per lot and track the trend → quarantine any lot that drifts outside spec |
| Liquid water resistance (Cobb/HST) | Absorption amount/penetration time | Confirmed by source (Sci Rep 2026, Hercules sizing test) | QA: test both the coated and uncoated face → if absorption trends upward, re-examine formulation or coat weight |
| Oil resistance (oil absorption) | Oil absorption amount | Confirmed by source (Sci Rep 2026) | QA: retest with the oil type relevant to the final packaging use (e.g., cooking oil) → log the gap between study conditions and actual-use conditions |
| Brightness | Pre/post-coat brightness | Confirmed by source (Sci Rep 2026 — nanocellulose showed higher brightness) | Coating dev team: compare brightness by formulation (nanochitin vs. nanocellulose) and check against print/label requirements |
| Coefficient of friction | Static/kinetic friction, coated and uncoated face | Not evaluated (limitation flagged by AZoNano) | QA: measure friction before the converting line → if outside target range, adjust surface treatment or formulation |
| Fold durability (crease cracking) | Crack rate at fold points | Not evaluated (limitation flagged by AZoNano) | QA runs the internal standard fold test and calculates crack rate → reassess coating thickness and drying if the result exceeds the internal tolerance |
| Water vapor/oxygen transmission | Measured value against end-use spec | Not evaluated (limitation flagged by AZoNano) | Coating dev team: measure independently and pre-set spec thresholds by end use (frozen/ambient/oily food) |
| Hold/conditioning parameters | Temp/humidity, hold time | Not evaluated (needs line-specific standardization) | QA: log conditioning-room environment and cross-check it whenever lot-to-lot reproducibility drifts |
Hold conditions
Roll back to the pilot stage — and hold off on a full line rollout — if any of the following apply:
- No viscosity-shear profile has been remeasured at actual line coating speed; a lab-only 5 cm/s curve is not sufficient basis for a decision.
- Thickness or coat-weight variance exceeds the pre-approved internal tolerance.
- Fold or friction testing shows coating delamination, cracking, or powdering.
- Water vapor or oxygen transmission — required for the end-use application — remains unevaluated. Neither the original study nor the follow-up coverage addressed these.
- Lot-to-lot reproducibility, including conditioning, has not yet been confirmed.
These five conditions also mark the boundary between what the research confirmed and what it didn’t. It showed improved water/air/oil resistance and differences in thickness and brightness — it did not address line speed, drying, friction, folding, moisture-barrier performance, or commercial-scale validation.
Samples and tests to run today
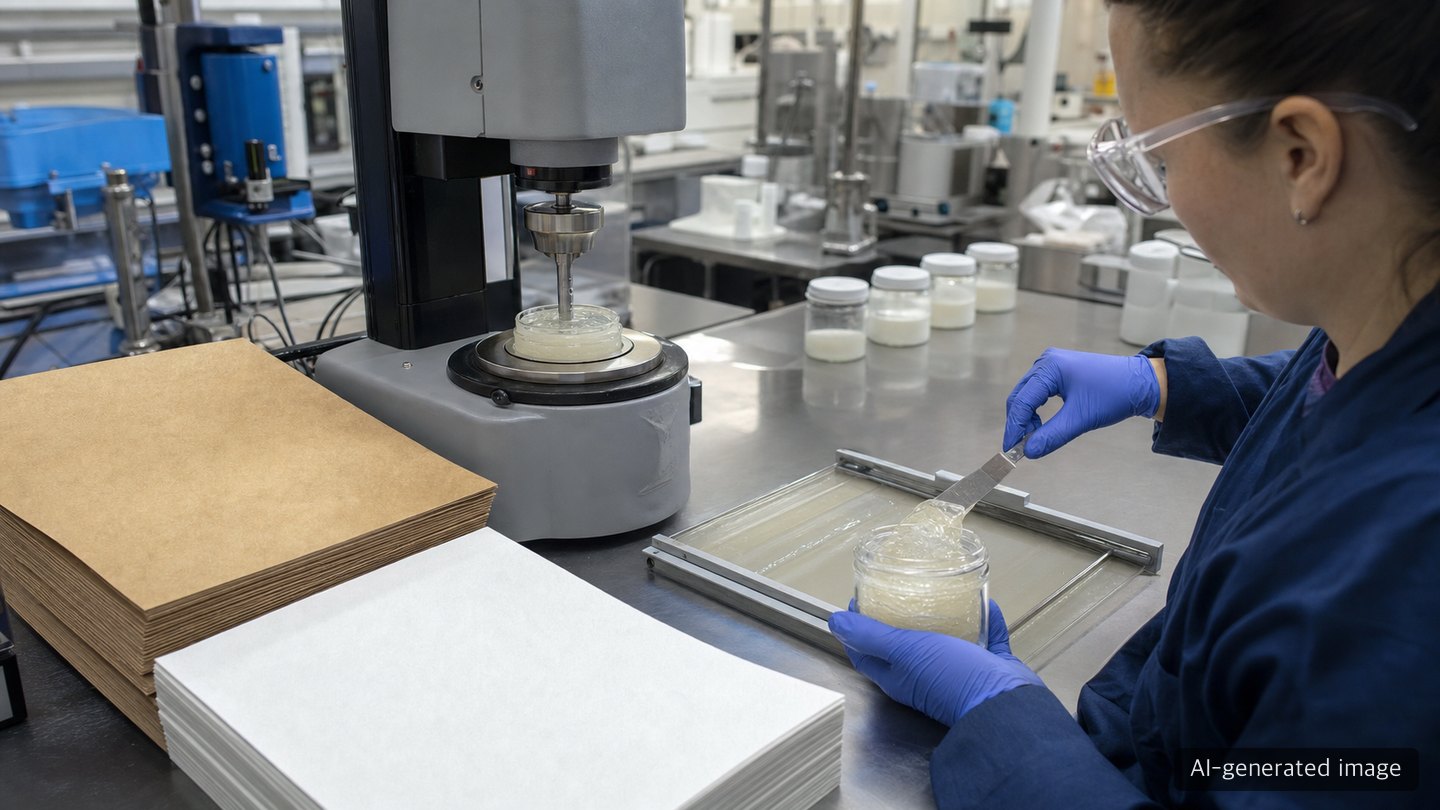
- Pull the actual-use gel formulation and measure viscosity across shear-rate ranges that represent the line coating speed.
- Sample the paper roll at start, middle, and end, and log the pre-coat basis weight for later comparison against post-coat values.
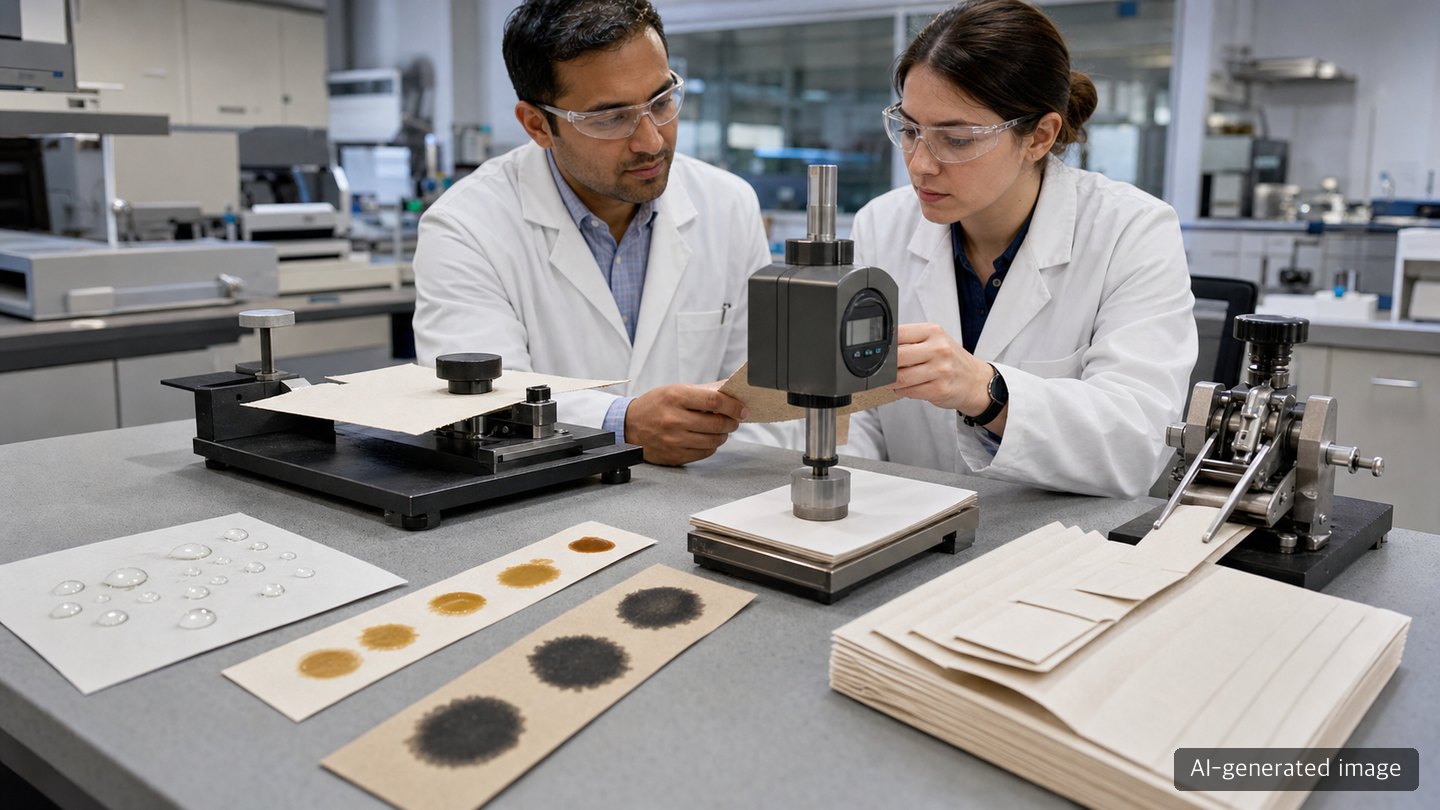
- Split a small batch into single- and double-layer coats and run a quick Cobb water test plus an oil absorption test to check whether the study’s directional findings — nanochitin for water/oil resistance, nanocellulose for brightness — hold up in your own formulation.
- Pull representative fold-test specimens and calculate the crack rate before the converting line.
Before the next trial
What this study actually delivered is directional barrier-improvement data, not a line spec sheet. Nanochitin’s edge in water/air/oil resistance and nanocellulose’s edge in brightness are a reasonable starting point for choosing a formulation, but until the line-condition rows in the table above are filled in with your own numbers, staying in the pilot stage is the right call. The place to start planning the next trial is a single document that lists, side by side, what the lab has confirmed and what your line hasn’t confirmed yet.
About the Author
PackingMaster: Editor of Paper Pack Log. We collect and organize market trends, product information, and technical insights for the paper packaging industry.
References
- Scientific Reports, “Evaluation of the properties of gel, film and paper coated with nanocellulose and nanochitin,” 2026-07-16, DOI 10.1038/s41598-026-62541-z. https://www.nature.com/articles/s41598-026-62541-z
- AZoNano, 2026-07-19. https://www.azonano.com/news.aspx?newsID=41768